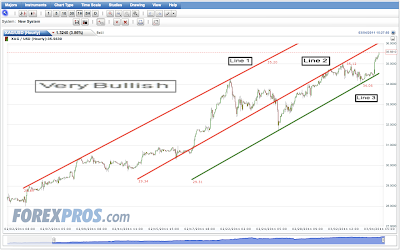
Hey everyone, today we saw silver go over $35. My next few charts will show how it is still very bullish. Even if we see a pull back, which is natural, the overall price in silver going up is bullish. I hope everyone stocked up on silver when it was $26.50 just a month ago :)
The first chart goes all the way back to the beginning of Feburary. You can clearly see the two red lines, (line 1 and line 2) create a channel where the price of silver bounced off the resistance (1) and came back up off the support line (2) . Then around Feb. 25th or so, the price broke the channel and dropped creating a new channel between line 2 and line 3 (green line). Since the price broke the resistance level of the second line, it now is the support line. Overall we just see this nice upward motion chart which obviously signals a bullish trend.

Some news from around the world today:
Liberia: http://english.aljazeera.net/indepth/spotlight/libya/2011/03/201134162742713130.html
Silver: http://www.marketoracle.co.uk/Article26674.html
Gold: http://news.ph.msn.com/business/article.aspx?cp-documentid=4690042
Currency: http://www.sltrib.com/sltrib/home/51364301-76/silver-gold-legal-tender.html.csp


No comments:
Post a Comment